


Geneva – The International Air Transport Association (IATA) released data for November 2023 global air cargo markets indicating the strongest year-on-year growth in roughly two years. This is partly due to weakness in November 2022, but also reflects a fourth consecutive month of strengthening demand for air cargo.
Global demand for air cargo, measured in cargo tonne-kilometres (CTKs), increased by 8.3% compared to November 2022. For international operations, demand growth was 8.1%.
Capacity, measured in available cargo tonne-kilometres (ACTKs), was up 13.7% compared to November 2022 (+11.6% for international operations). Most of the capacity growth continues to be attributable to the increase in belly capacity as international passenger markets continue their post-COVID recovery.
Compared to November 2019 (pre-COVID-19), demand is down 2.5% while capacity is up 4.1%.
Some indicators to note include :
• Both the manufacturing output and new export order Purchasing Managers Indexes (PMIs) – two leading indicators of global air cargo demand—continued to hover just below the 50-mark in November with small positive movements indicating a deceleration of the economic slowdown.
• Global cross-border trade recorded growth for the third consecutive month in October, reversing its previous downward trend.
• Inflation in major advanced economies continued to soften in November as measured by the corresponding Consumer Price Index (CPI), centering around 3% year-on-year for the United States, Japan, as well as the EU, in November. In the meantime, China exhibited negative annual growth in its CPI for the second time in a row.
• Air cargo yields (including surcharges) continued their significant upward trend (+8.9% since October). Rising yields are in line with improving air cargo load factors over recent months. This could be tied in part to booming e-commerce deliveries from China to western markets.
“November air cargo demand was up 8.3% on 2022—the strongest year-on-year growth in almost two years. That is a doubling of October’s 3.8% increase and a fourth month of positive market development. It is shaping up to be an encouraging year-end for air cargo despite the significant economic concerns that were present throughout 2023 and continue on the horizon,” said Willie Walsh, IATA’s Director General.
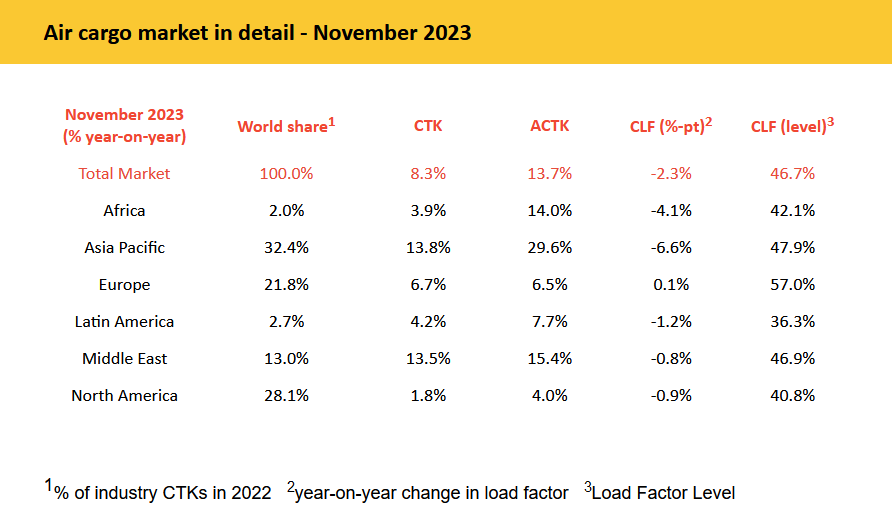
| November Regional Performance (total market) Asia-Pacific airlines saw their air cargo volumes increase by 13.8% in November 2023 compared to the same month in 2022. This performance was significantly above the previous month’s growth of 7.6%. Available capacity for the region’s airlines increased by 29.6% compared to November 2022 as more belly capacity came online with the removal of COVID-19 restrictions. North American carriers had the weakest demand growth in November with a 1.8% increase (YoY) in cargo volumes. This was, nonetheless, a significant improvement in performance compared to October’s -1.8% contraction. Capacity increased by 4.0% compared to November 2022. European carriers saw their air cargo volumes increase by 6.7% in November compared to the same month in 2022. This was a stronger performance than in October (1.0%). Capacity increased 6.5% in November 2023 compared to 2022. Middle Eastern carriers had the strongest performance in November 2023, with a 13.5% year-on-year increase in cargo volumes. This was similar to the significant improvement noted in the previous month’s performance (+13.0%). Capacity increased 15.4% compared to November 2022. Latin American carriers experienced a 4.2% increase in cargo volumes compared to November 2022, very similar to the 4.0% year-on-year increase recorded for October. Capacity in November was up 7.7% compared to the same month in 2022. African airlines saw their air cargo volumes increase by 3.9% in November 2023, slightly improved compared to October’s +2.9% growth performance. Capacity was 14.0% above November 2022 levels. View the November Air Cargo Market Analysis |
| November Regional Performance (total market) Asia-Pacific airlines saw their air cargo volumes increase by 13.8% in November 2023 compared to the same month in 2022. This performance was significantly above the previous month’s growth of 7.6%. Available capacity for the region’s airlines increased by 29.6% compared to November 2022 as more belly capacity came online with the removal of COVID-19 restrictions. North American carriers had the weakest demand growth in November with a 1.8% increase (YoY) in cargo volumes. This was, nonetheless, a significant improvement in performance compared to October’s -1.8% contraction. Capacity increased by 4.0% compared to November 2022. European carriers saw their air cargo volumes increase by 6.7% in November compared to the same month in 2022. This was a stronger performance than in October (1.0%). Capacity increased 6.5% in November 2023 compared to 2022. Middle Eastern carriers had the strongest performance in November 2023, with a 13.5% year-on-year increase in cargo volumes. This was similar to the significant improvement noted in the previous month’s performance (+13.0%). Capacity increased 15.4% compared to November 2022. Latin American carriers experienced a 4.2% increase in cargo volumes compared to November 2022, very similar to the 4.0% year-on-year increase recorded for October. Capacity in November was up 7.7% compared to the same month in 2022. African airlines saw their air cargo volumes increase by 3.9% in November 2023, slightly improved compared to October’s +2.9% growth performance. Capacity was 14.0% above November 2022 levels. View the November Air Cargo Market Analysis |
| For more information, please contact: Corporate Communications Tel: +41 22 770 2967 Email: corpcomms@iata.org Notes for Editors: • * Please note that as of January 2020 onwards, we have clarified the terminology of the Industry and Regional series from ‘Freight’ to ‘Cargo’, the corresponding metrics being FTK (changed to ‘CTK’), AFTK (changed to ‘ACTK’), and FLF (changed to ‘CLF’), in order to reflect that the series have been consisting of Cargo (Freight plus Mail) rather than Freight only. The data series themselves have not been changed. • IATA (International Air Transport Association) represents some 320 airlines comprising 83% of global air traffic. • You can follow us at twitter.com/iata for announcements, policy positions, and other useful industry information. • Explanation of measurement terms: o CTK: cargo tonne-kilometers measures actual cargo traffic o ACTK: available cargo tonne-kilometers measures available total cargo capacity o CLF: cargo load factor is % of ACTKs used • IATA statistics cover international and domestic scheduled air cargo for IATA member and non-member airlines. • Total cargo traffic market share by region of carriers in terms of CTK is: Asia-Pacific 32.4%, Europe 21.8%, North America 28.1%, Middle East 13.0%, Latin America 2.7%, and Africa 2.0%. |


Be the first to comment on "Air Cargo Demand Up 8.3% in November"