


Air Cargo Shows Signs of Improvement in February
04 April 2023 Geneva – The International Air Transport Association (IATA) released data for February 2023 global air cargo markets showing that air cargo demand rose above pre-pandemic levels.
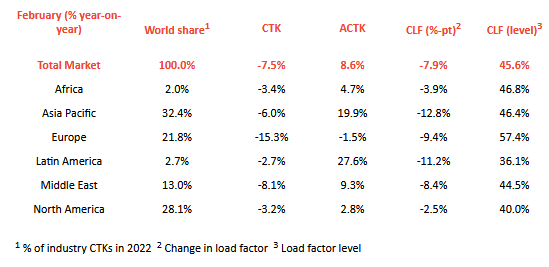
Global demand, measured in cargo tonne-kilometers (CTKs*), fell 7.5% compared to February 2022 (-8.3% for international operations). This was half the rate of annual decline seen in the previous two months (-14.9% and -15.3% respectively). February demand for air cargo was 2.9% higher than pre-pandemic levels (February 2019)—the first time it has surpassed pre-pandemic levels in eight months.

Capacity (measured in available cargo tonne-kilometers, ACTK) was up 8.6% compared to February 2022. The strong uptick in ACTKs reflects the addition of belly capacity as the passenger side of the business continues to recover. International belly-capacity grew by 57.0% in February year-over-year, reaching 75.1% of the 2019 (pre-pandemic) capacity.

Several factors in the operating environment should be noted:

    The global new export orders component of the manufacturing PMI, a leading indicator of cargo demand, continued to increase in February. China’s PMI level surpassed the critical 50-mark indicating that demand for manufactured goods from the world’s largest export economy is growing.

    Global goods trade decreased by 1.5% in January; this was a slower rate of decline than the previous month of -3.3%.

    The Consumer Price Index for G7 countries decreased from 6.7% in January to 6.4% in February. Inflation in producer (input) prices reduced by 2.2 percentage points to 9.6% in December (last available data).
”The story of air cargo in February is one of slowing declines. Year-on-year demand fell by 7.5%. That’s half the rate of decline experienced in January. This shifting of gears was sufficient to boost the overall industry into positive territory (+2.9%) compared to pre-pandemic levels. An optimistic eye could see the start of an improvement trend that leads to market stabilization and a return to more normal demand patterns after dramatic ups-and-downs in recent years,” said Willie Walsh, IATA’s Director General.
February Regional Performance
Asia-Pacific airlines saw their air cargo volumes decrease by 6.0% in February 2023 compared to the same month in 2022. This was a significant improvement in performance compared to January (-19.0%).  Airlines in the region benefitted from China’s reopening, which saw restrictions lifted and economic activities resumed. Available capacity in the region increased by 19.9% compared to February 2022 as more and more belly capacity came online from the passenger side of the business.
North American carriers posted a 3.2% decrease in cargo volumes in February 2023 compared to the same month in 2022. This was a solid improvement in performance compared to January (-8.7%).  Notably, the region saw a significant increase in international demand in February which boosted its market share in international cargo traffic to beyond pre-pandemic levels (21.7% in Feb 2023 versus 18.2% in Feb 2019). Capacity increased 2.8% compared to February 2022.
European carriers saw the weakest performance of all regions with a 15.3% decrease in cargo volumes in February 2023 compared to the same month in 2022. This was an improvement in performance compared to January (-20.4%). Airlines in the region continue to be most affected by the war in Ukraine. Capacity decreased 1.5% in February 2023 compared to February 2022.
Middle Eastern carriers experienced an 8.1% year-on-year decrease in cargo volumes in February 2023. This was a slight improvement to the previous month (-11.8%). Capacity increased 9.3% compared to February 2022.
Latin American carriers reported a 2.7% decrease in cargo volumes in February 2023 compared to February 2022. This was a drop in performance compared to January which saw a 4.6% increase. Capacity in February was up 27.6% compared to the same month in 2022.
African airlines saw cargo volumes decrease by 3.4% in February 2023 compared to February 2022. This was an improvement in performance compared to the previous month (-9.5%). Notably, the Africa to Asia route area experienced significant cargo demand growth in February, up 39.5% year-on-year. Capacity was 4.7% above February 2022 levels.
* Please note that as of January 2020 onwards, we have clarified the terminology of the Industry and Regional series from ‘Freight’ to ‘Cargo’, the corresponding metrics being FTK (changed to ‘CTK’), AFTK (changed to ‘ACTK’), and FLF (changed to ‘CLF’), in order to reflect that the series have been consisting of Cargo (Freight plus Mail) rather than Freight only. The data series themselves have not been changed.
IATA (International Air Transport Association) represents some 300 airlines comprising 83% of global air traffic.
You can follow us at twitter.com/iata for announcements, policy positions, and other useful industry information.
Explanation of measurement terms:
CTK: cargo tonne-kilometers measures actual cargo traffic
ACTK: available cargo tonne-kilometers measures available total cargo capacity
CLF: cargo load factor is % of ACTKs used
IATA statistics cover international and domestic scheduled air cargo for IATA member and non-member airlines.
Total cargo traffic market share by region of carriers in terms of CTK is: Asia-Pacific 32.4%, Europe 21.8%, North America 28.1%, Middle East 13.0%, Latin America 2.7%, and Africa 2.0%.
Fly Net Zero
Source: IATA


Be the first to comment on "Air Cargo Shows Signs of improvement"