


During recent storms, satellites recorded ocean waves averaging nearly 20 metres high – as tall as the Arc de Triomphe in Paris and the largest ever measured from space. Moreover, satellite data now reveal that ocean swells act as storm ‘messengers’: even though a storm may never make landfall, its swell can travel vast distances and bring destructive energy to distant coastlines.
Driven by wind, waves are at their most powerful during storms, yet the greatest threat to coastlines often does not come from the storm itself, but from the long swells that carry wave energy far beyond the storm’s reach.
These long waves radiate across oceans, and their properties – such as wave period, or the time between crests – reveal the storm’s size and strength. For example, a 20-second period means a large wave arrives every 20 seconds.
To shed new light on storm waves and ocean swells a research team, funded through ESA’s Climate Change Initiative (CCI), combined data from the relatively new French–US SWOT satellite with the CCI Sea State project’s decades-long record that incorporates measurements stretching back to 1991.
This record merges data from satellites such as SARAL, Jason-3, Copernicus Sentinel-3A and -3B, Copernicus Sentinel-6 Michael Freilich, CryoSat and CFOSAT.

Led by Fabrice Ardhuin, from the Laboratory of Physical and Spatial Oceanography in France, the team not only confirmed the exceptional nature of storms in 2023 and 2024 but also focused on the scale of swells in remote ocean areas and measured the properties of waves in storms before they become swells.
The team analysed data from SWOT collected on 21 December 2024 during the peak of Storm Eddie, the largest storm in terms of average wave height over the past decade – and generated a new record wave height of nearly 20 metres in the open ocean.
Beyond measuring the wave height, the team was able to track the storm’s swell radiating across 24 000 km of ocean, from the North Pacific through the Drake Passage all the way to the tropical Atlantic, between 21 December 2024 and 6 January 2025.
The team’s new findings, published recently in the journal PNAS, are the first to directly offer observations to validate numerical wave models in extreme conditions, correcting existing wave energy calculations.

The model’s outputs from the CCI Sea State project dataset are closely linked to satellite measurements. This is seen when comparing the outputs across different missions and using SWOT imagery to estimate periods.
This information could help protect coastal communities and marine infrastructure as climate patterns shift.
Scientists had long believed that very long ocean waves carried substantial amounts of energy as they propagated across ocean basins, but these new findings also demonstrate that the energy content of such waves has been systematically overestimated.
This means that more energy than expected is actually concentrated in dominant storm waves, rather than being distributed among the longest waves.
Models show that the highest waves of the past 34 years occurred in January 2014, when Atlantic Storm Hercules produced 23-metre waves that caused severe damage from Morocco to Ireland.
Dr Ardhuin said, “Our next step is to link the findings to climate change. We will test this with modelling. We are now able to track storm intensity trends over time. Climate change may be a driver, but it is not the only one. At the coast, seabed conditions also shape waves, for example, and these very large storms are rare – occurring roughly once a decade – which makes it hard to prove trends.”
Value of combining data
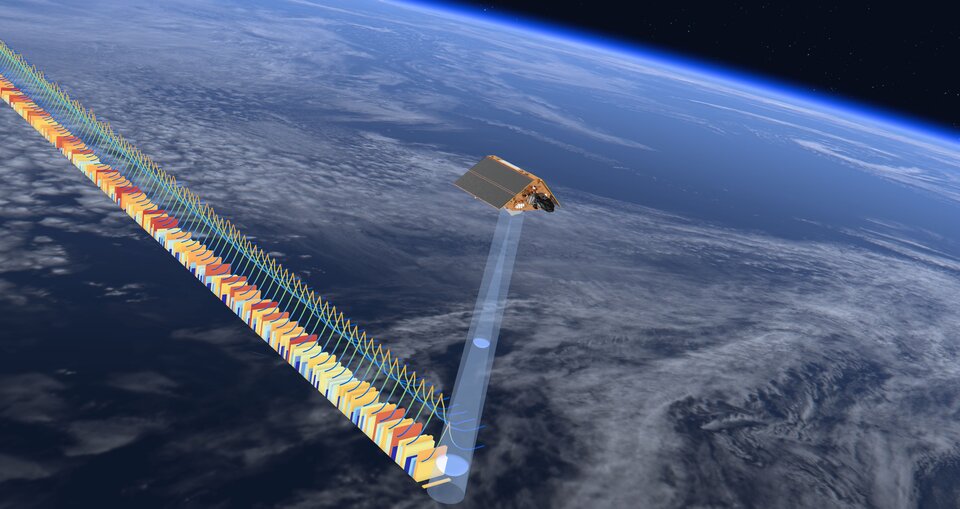
SWOT combines traditional radar altimetry with wide-swath imaging to measure swell height, length and direction. These measurements help pinpoint where waves originate and capture swells as low as 3 cm, revealing wavelengths of up to 1400 m, which other satellite sensors often miss. This range of wavelengths has been applied to data collected by ESA-developed satellites.
The fuller view of energy across wavelengths shows that very long swells carry less energy than assumed, while more energy concentrates in the dominant peak waves. Although these waves remain destructive, their true energy dynamics are now better understood. It’s like a boxer who, instead of throwing many weak punches, concentrates their power in a few powerful ones.
Copernicus Sentinel-6
Data from the Copernicus Sentinel-6 mission were used in the study. The mission comprises two identical satellites – firstly, Copernicus Sentinel-6 Michael Freilich, which was launched on 21 November 2020 and then Copernicus Sentinel-6B set for launch in a few weeks.
While the mission is the current reference mission to track sea-level rise, it also provides data for practical ‘operational’ applications.
For example, the mission measures significant wave height and wind speed, data that are used for near-realtime ocean forecasting
Source: ESA


Be the first to comment on "Satellites reveal the power of ocean swell"